I've continued my optimization work through May and today I'll be reporting the status of the next benchmark: a little Clojure ray tracer. Before jumping into the details, I want to say thank you to my Github sponsors and to Clojurists Together for sponsoring me this whole year. Thank you!
The ray tracer
A whopping three years ago, I wrote a blog post focused on optimizing a ray tracer. This was before jank fully supported macros, before jank had seamless C++ interop, before jank had beautiful error messages, and before jank could AOT compile programs. This was still when I was working at EA and building jank during my nights and weekends.
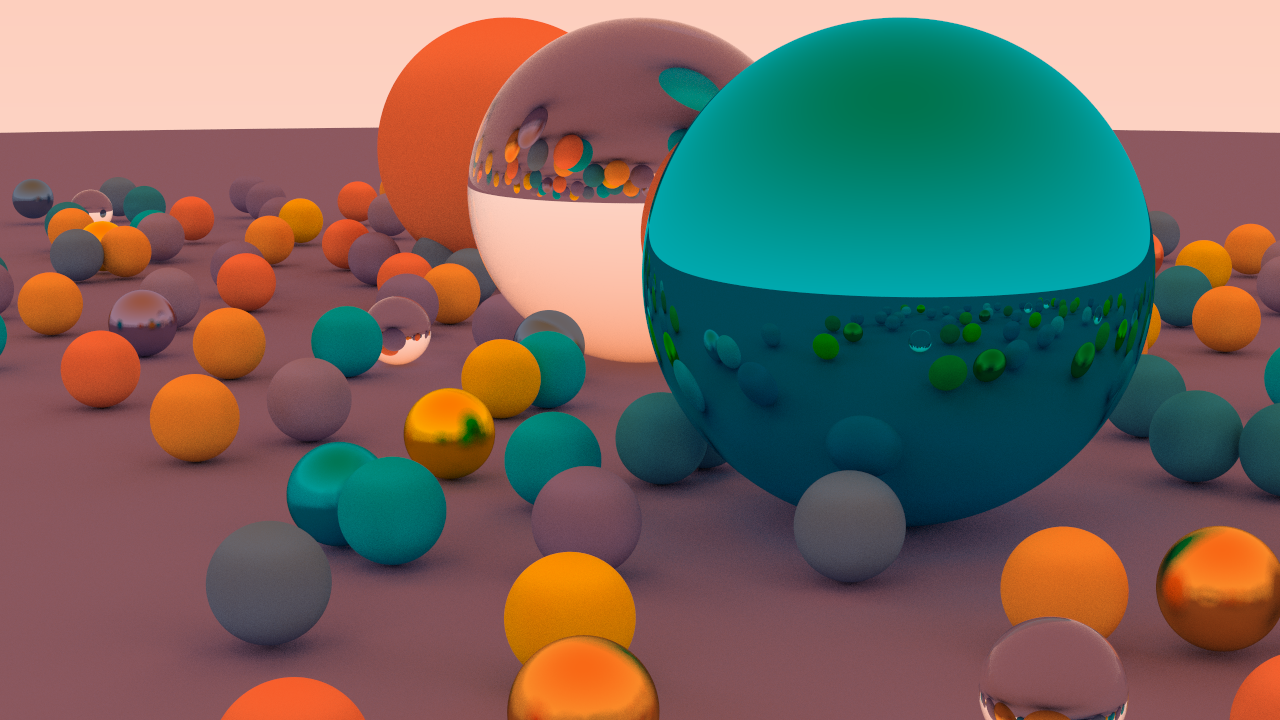
Now it's time to revisit this benchmark, but with some modern updates. I have patched the ray tracer to use idiomatic macros, to invoke keywords to do map lookups, and to use jank's new seamless C++ interop as needed. I've also spiced up the visuals a bit. Here's the image we're going to be building.
The code
You can find the full ray tracer source code here. Note that Clojure JVM and jank are using the same source file. This particular ray tracing code is not optimized to be fast. It's written to just be naíve Clojure code, as though we had no care in the world. What we're optimizing is how well jank can handle this code, compared to Clojure. If someone wanted to write a CPU ray tracer in Clojure and have it be fast, the code would look quite different.
The main thing to keep in mind, for the ray tracer, is that we generate a "scene" of spheres, each with a particular material. We then cast a bunch of rays and bounce them all around the scene, collecting colors from the sky and the various spheres they bounce into. Our rays are just Clojure maps which look like this.
{:r 1.04
 :g 0.00377
 :b 37.1984}
Spheres are also just Clojure maps and look like this.
{:center (vec3-create 0 -1000 0)
 :radius 1000
 :material {:albedo (color 79 71 137)
            :scatter scatter-lambertian}}
We expect to spend most of our time creating maps, looking up values in maps, and crunching numbers. Each ray is a map, each bounce off a sphere creates a new ray, and basically all math is done one the components of these rays and spheres.
Baseline numbers
For this blog post, we're generating a 100x60 version of the above image. Using OpenJDK 21 (default on my distro), Clojure 1.12.4 on my x86_64 Linux machine takes 2.53 seconds. By using a relatively large image size here, and a longer benchmark, we're spending more time generating garbage and triggering more GC collections. Overall, this gives us a better impression of not only how quickly Clojure/jank can render this image, but also how well they hold up when doing this for a longer period of time.
On the jank side, we start our benchmark time at 8.10 seconds. That's roughly 3.2x slower than Clojure, to start with. I do look forward to starting on benchmarks and having jank already be faster than Clojure, but we're not quite there yet. Here's a chart. Did you know these are written in Clojure?

NaN boxing
For our last optimization benchmark, a recursive fibonnaci function, we implemented tagged pointers for integers. This allowed us to avoid dynamic allocations for most integers by encoding them within the pointer and using the lowest bit of the pointer to denote this special case. This worked really well, but it only applied to integers. Many real world programs, and indeed our ray tracer, are built around floating point numbers. The very first thing I want to tackle is how to avoid dynamic allocations for all of these floating point numbers. However, encoding floating point numbers into a 64 bit pointer is much more involved, since 64 bit IEEE 754 doubles have a particular layout, with each bit assigned to a specific role. They look like this.
seeeeeee|eeeemmmm|mmmmmmmm|mmmmmmmm|mmmmmmmm|mmmmmmmm|mmmmmmmm|mmmmmmmm
 ^- exponent ^- mantissa
^- sign bit
Note, I am using the same visualization that Nikita Popov did on his beautiful post about NaN boxing, since it's my favorite of all that I've read. I am going to briefly summarize this approach, but Nikita does a great job of getting more into the details. He even provides some helpful starter code.
Part of the encoding of these doubles is the ability to represent NaN, or "not a number". There are a couple of different bit patterns used to identify NaN. For our use case, if all exponent bits are set, and the first mantissa bit is set, we have a NaN. The sign bit doesn't matter and the remaining 51 bits are a "payload" which was originally designed to hold error information. We'll endeaver to represent our pointer there.
seeeeeee|eeeemmmm|mmmmmmmm|mmmmmmmm|mmmmmmmm|mmmmmmmm|mmmmmmmm|mmmmmmmm
s1111111|11111ppp|pppppppp|pppppppp|pppppppp|pppppppp|pppppppp|pppppppp
             ^- first mantissa bit 1    everything else is "payload" -^
 ^- exponent bits all 1
^- any sign bit
But how do we store a 64 bit pointer in 51 bits? Well, it turns out that most pointers are actually 48 bits, not 64 bits. This is because 64 bits is simply far too much address space to worry about (16 Exabytes). As Nikita says:
Unsurprisingly we aren’t the first to notice this: the x86-64 architecture utilizes only the lower 48 bits (which still allows 256 TiB) of a pointer. Additionally bits 63 through 48 must be copies of bit 47. Pointers that follow this pattern are called canonical.
In other words, if our pointers are actually only 48 bits, they can fit in our 51 bit payload! Thus, our encoded pointers end up looking like this.
seeeeeee|eeeemmmm|mmmmmmmm|mmmmmmmm|mmmmmmmm|mmmmmmmm|mmmmmmmm|mmmmmmmm
11111111|11111010|pppppppp|pppppppp|pppppppp|pppppppp|pppppppp|pppppppp
 ^- exponent   ^- pointer tag
             ^- first mantissa bit set
^- set sign bit
You'll note we also set the third highest mantissa bit, which is used to denote that the NaN value holds a pointer. We do a similar thing for integers, but with the fourth highest mantissa bit, and then we store a 32 bit integer within the 51 bit payload. We could store more integer bits, but just using 32 and 64 bits for integers makes things simpler. Note that, for both of these, we set the sign bit, but that's not necessary.
seeeeeee|eeeemmmm|mmmmmmmm|mmmmmmmm|mmmmmmmm|mmmmmmmm|mmmmmmmm|mmmmmmmm
11111111|11111001|00000000|00000000|iiiiiiii|iiiiiiii|iiiiiiii|iiiiiiii
 ^- exponent    ^- integer tag
             ^- first mantissa bit set
^- set sign bit
Finally, this means that a "pointer" value in jank is either:
- An unmodified double
- A 48 bit pointer in NaN space
- A 32 bit integer in NaN space
The only other thing we have to worry about is jank's conservative garbage collector, BDWGC, since it needs to scan memory for pointers to mark which objects are alive. Fortunately, we can easily do this by configuring BDWGC with a pointer mask of 0x0000FFFFFFFFFFFF, so that it strips out the upper two NaN-related bytes and just looks at the bottom 6 payload bytes.
All of this allows us to completely eliminate all dynamic allocations for floating point values. Let's take a look at our new benchmark time. We're down from 8.10 seconds to 4.16 seconds!

I love starting with big wins. This was such a fun optimization to learn about, too.
The changes: a7cff49856d3df04b3ebc4d15b556fe7264ed0de.
More inlining
Following up on the last optimization post, we ended up adding :inline support for clojure.core functions and that had a lot of benefit for our benchmark time. The next thing I tackled was to add :inline metadata to every function where it made sense, rather than just the arithmetic functions we updated previously. Unfortunately, it had absolutely no impact on the benchmark time. It's good to have, though, since those inlined functions will avoid var derefs and better propagate type information.
The changes: 64ee01e8f85aa574d1ff50451a7c2ba7d942299f.
Removing dynamic_call
Another item I knew I'd have to tackle for this benchmark is jank's dynamic_call. This has historically been the work horse function for invoking an arbitrary callable object in jank. We used to have a closed object model, using just a tagged union, so we didn't have virtual functions or inheritance to rely on for implementing things like a call or invoke behavior. However, we now have an open object model, with a base object type and a set of virtual call functions. This means we can get rid of dynamic_call entirely and let the C++ compiler handle dynamic dispatch for us.
But what does this function do? Well, Clojure function invocation isn't always as clear cut as just calling a function with some arguments. Often times, there's some form of argument packing required. For example, let's consider this function.
(defn foo [x & args]
  (println x args))
This function has two parameters, but the second parameter is a sequence of "everything else" passed after the first parameter. If we call this with one argument, like (foo 1), then args will implicitly be nil. But if we call this with three arguments, like (foo 1 2 3), then args will be a list containing (2 3). It has been on dynamic_call to ensure all of this happens properly. However, we only need to worry about these more complicated cases when a function is variadic, so the main optimization we're doing by removing dynamic_call is that we're ignoring all of this complexity for non-variadic functions, which is fortunately the majority of functions. Instead, we move that functionality into their virtual call functions and we ensure we have dedicated function types for both variadic and non-variadic functions.
That drops us from 4.16 seconds to 3.02 seconds. We're within arm's reach of Clojure now. Let's see what more we can do.

The changes: ca77a31d9e47503e83bf696f628ac70504db6862.
Time to profile
At this point, I didn't have any more planned changes, so I took a look at the profiler. The results were very clear. We were spending our time doing the following things, in order.
- Creating maps (mainly the allocation)
- Looking up values in maps (via calling keywords)
- Doing some arithmetic
These are exactly the places where we expected to be spending time, which is a good news. The bad news is that there are no more easy wins.
To address the first issue, of map creation and garbage, I hooked in precise GC tracking for array maps. This takes advantage of a BDWGC feature that allows for registering type layouts in advance and then using them when making allocations. BDWGC will use the layout information to more precisely scan those values, rather than just scanning the whole thing. This is a good change to have, but it didn't actually affect the benchmark. I've kept the code, though, since it will aid in future benchmarks.
The changes: dc703b3c8873e29dcc102e9aa7b7e90dbf9bb6bc.
Next, I tried optimizing the map lookups. In this version of the ray tracer, we're using Clojure's syntactic sugar of calling keywords to access values in a map, like (:g ray). jank is generating a call through the keyword object, which is then doing a call to jank::runtime::get. I added a bit to the analyzer to detect these cases and inline the call instead, so we skip over the virtual call through the keyword. I also brought some more map lookup functions from their .cpp files into the .hpp files so that they could be inlined.
These two changes dropped us from 3.02 seconds to 2.37 seconds, which puts us ahead of Clojure's 2.53 seconds!

The changes: 59b0a864c366a786a4d3468f69b9e4261a426ceb and dac1d892a869196478a58edf5477766e1e61ca41.
While making these changes, I found that I could add an overload of get to object which took a keyword, which then allowed me to propagate type info all the way to the array map lookup. This optimized things even further, but it has two issues:
- It muddies up the object interface
- It helps this benchmark, but it won't help any other map use cases
This is worth noting, since the changes I'm making in these posts are not just any change I can possibly muster to beat the benchmark. I will take the slower time if it means not sacrificing on API design.
Further wins
I am too competitive to stop after only just beating Clojure on this benchmark, so I'd be lying if I said I didn't keep digging. However, I wasn't able to find much more in terms of performance wins. I have some future plans, such as replacing jank's GC with one which is precise (Immix/LXR), but for now we'll have to settle with being just slightly faster than Clojure. Oh well.
I did, however, find some code size reduction wins.
Code size reductions
One thing I did do was take the time to write a couple of optimization passes which take advantage of our fancy new IR. Firstly, I wrote a pass for -O1 (optimization level 1) which dedupes and hoists literals into the lowest common scope. For example, take this function, which references 5 in four different blocks and also "not" in two different blocks.
(fn foo [a]
  (let [r (if (= 5 a)
            (println 5)
            (if (even? a)
              (println "not" 5 "but even")
              (println "not" 5 "but odd")))]
    r))
jank already did the work of lifting these literals to be allocated as globals, but one thing we hadn't yet done was to dedupe the uses of the literals in the code. So each of these uses of 5 would have its own local which referenced the allocated global.
On top of that, I added a pass for -O3 (highest optimization level) which does the same sort of optimization, but for var derefs. This is an interesting optimization, since we use vars to provide stable names for containers of values which may change at run-time. Clojure's semantics rely on var updates propagating through the system, but the exact granularity of that is not well defined. This particular optimization bends those semantics, but does not break them. We eliminate duplicate var derefs within functions, so that the granularity of var derefs ends up being at the function level, rather than the expression level. If a function has a loop in it, this optimization pass will be skipped for that function. Similarly, if a var is dynamic, this optimization pass will not hoist derefs of that var.
So, we eliminate duplicate var derefs within a function, assuming the var is not dynamic and the function doesn't contain a loop. This is a nice balance of maintaining interactive abilities while also not having to deref vars on every single usage. For example, this printing function from our ray tracer references clamp and print+space three times each. With this new pass, we will deref each var once and then use that for the rest of the function. Instead of six var derefs every time we call vec3-print, we have two.
(defn vec3-print [v samples-per-pixel]
  (let [scale (/ 1.0 samples-per-pixel)
        r (sqrt (* scale (:r v)))
        g (sqrt (* scale (:g v)))
        b (sqrt (* scale (:b v)))]
    (print+space (int (* 256.0 (clamp r 0.0 0.999))))
    (print+space (int (* 256.0 (clamp g 0.0 0.999))))
    (print+space (int (* 256.0 (clamp b 0.0 0.999))))))
The careful edge cases we have, namely detecting loops and dynamic vars, allow this optimization to work in most practical cases, but each optimization can be individually disabled if needed. Following how C++ compilers work, -O3 is dedicated to the most intense optimizations.
These are the first passes to be written for jank's new IR and the result has been huge. The amount of C++ code generated for clojure.core alone was cut by over 30%. The run-time performance wins were only marginal, but since compilation times are one of jank's biggest challenges, being able to cut down our generated code size by a third is an incredible win.
For a whole lot more info on exactly how these two passes were implemented, check out this YouTube video of me actually implementing them on my Twitch stream.
The changes: a217f6d2ba01f18acfa1bd5e665e954c63ac69b0 and fab6e459ea3a7afe147f953cdb32514e124c9e2e.
Community updates
On the topic of benchmarking, I want to call out Kyle Cesare, once again, for his amazing contributions to jank. I previously highlighted him for implementing jank's nREPL server, in jank. More recently, he contributed two items which aid in my benchmarking work.
Firstly, Kyle created a continuous benchmarking suite, which you can find here. It's called is-jank-fast-yet. You can see the progress there, from my recent benchmarking work. Just note that it may lag a bit behind jank, but it runs from main every night.
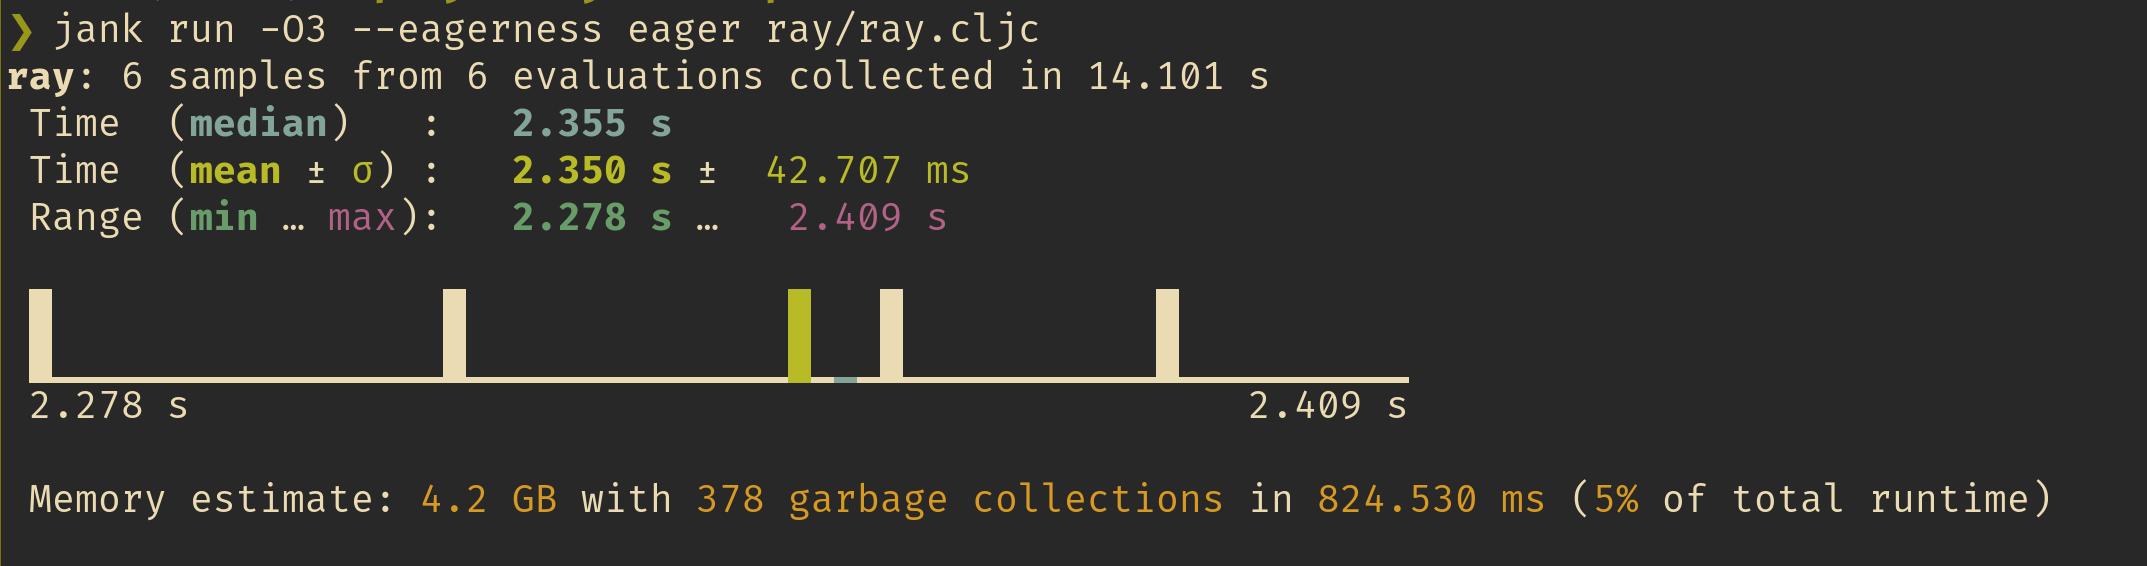
Secondly, Kyle also rewrote jank's benchmarking API and reporting so that we now get gorgeous benchmarking reports. This fancy new API includes a histogram, variance info, and even GC stats for total amount allocated and estimated time spent doing collections. What's even cooler is that it's all written in jank. Here's a report of running the ray tracer benchmark.
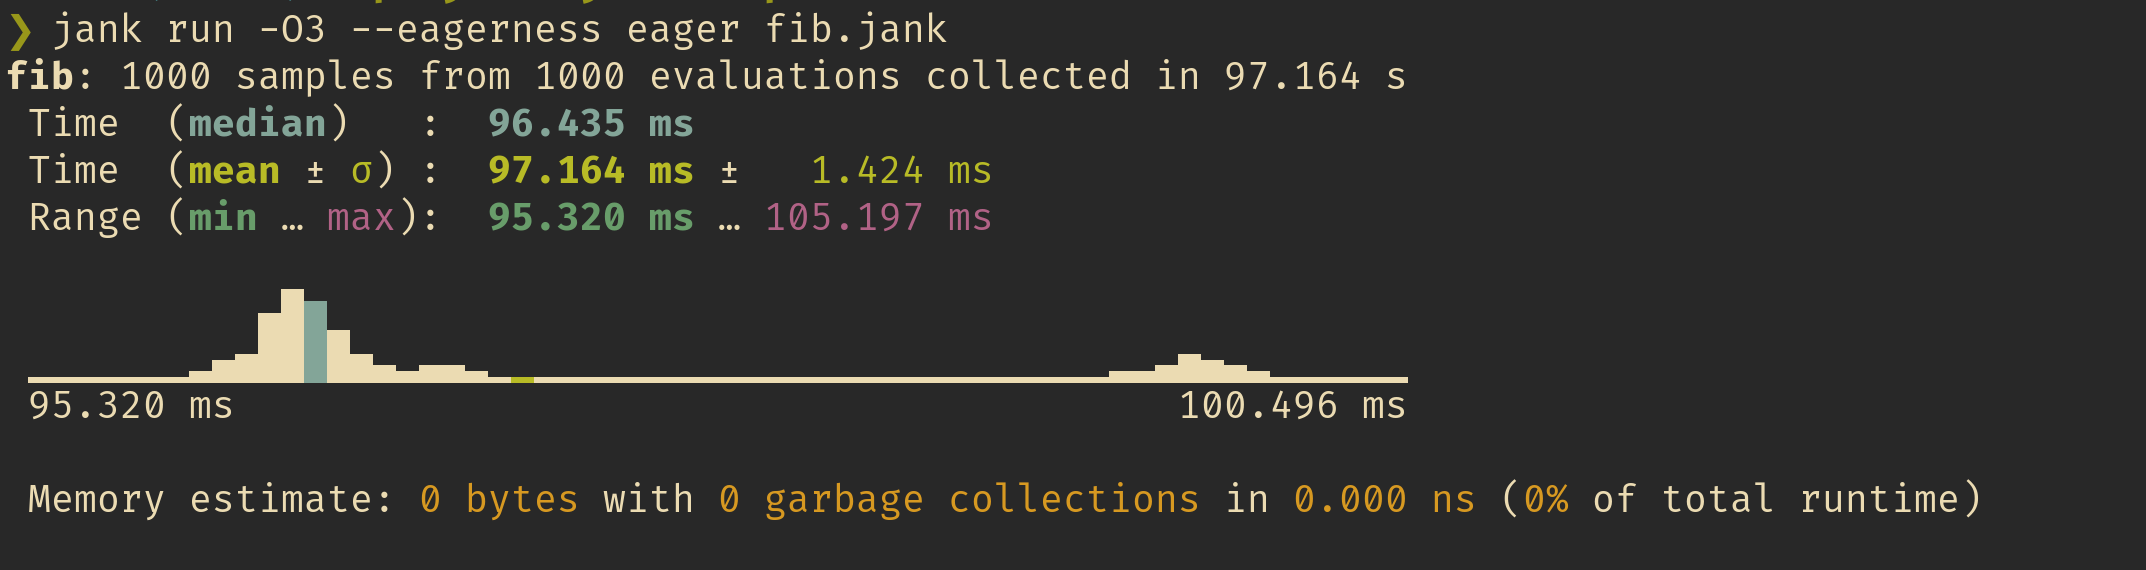
We can see the histogram really come to shape with more samples, like when we run our fibonnaci benchmark from last post (which is now even faster).
Thank you, Kyle! Your excellent contributions are appreciated.
What's next
Working on performance again has been lovely. After building out the new IR, I'm glad I've been able to optimize these two benchmarks and ensure that jank is still going the right direction. We can still reliably beat Clojure, with some work! On top of that, with the help of Kyle, we now have a continuous benchmarking dashboard to ensure jank only gets faster. As much as I'd love to pick up the next benchmark and continue, with Clojure Conj coming up in four months, and hopefully jank's beta release at the end of the year, I need to switch focus now to more pressing issues. The most important task on the queue is improving our AOT robustness and distribution story.
We need to be able to easily build real world jank apps and ship them. This is quite difficult, since packaging a jank app may also mean packaging jank's LLVM alongside it. On top of that, we need to ensure we can compile jank apps to static libraries and shared libraries, so people can embed them in their native applications. We also need the ability to bake jank apps down to a binary with no LLVM dependency, like Graal's native images. Each of these things needs a functionality pass, a polish pass, and an error messaging pass, before I can sign off on them. But each one of these makes jank more and more compelling.
Stay tuned for the next update!